
Tools mentioned in this article
Open the browser-based tool while you read and try the workflow immediately.
Is Your Architecture Diagram Still a Whiteboard Photo?
A photo of the whiteboard from a design meeting quietly becomes “the latest architecture diagram.” It happens a lot. Cleaning it up in a drawing tool means drawing frames, hunting for icons and straightening every bend of every line one by one, which is more work than it sounds.
Text-based layout such as Mermaid is quick, but it is not good at boxing in boundaries (“inside Cloudflare”, “inside our server”, “external services”) or at letting you decide where each thing sits.
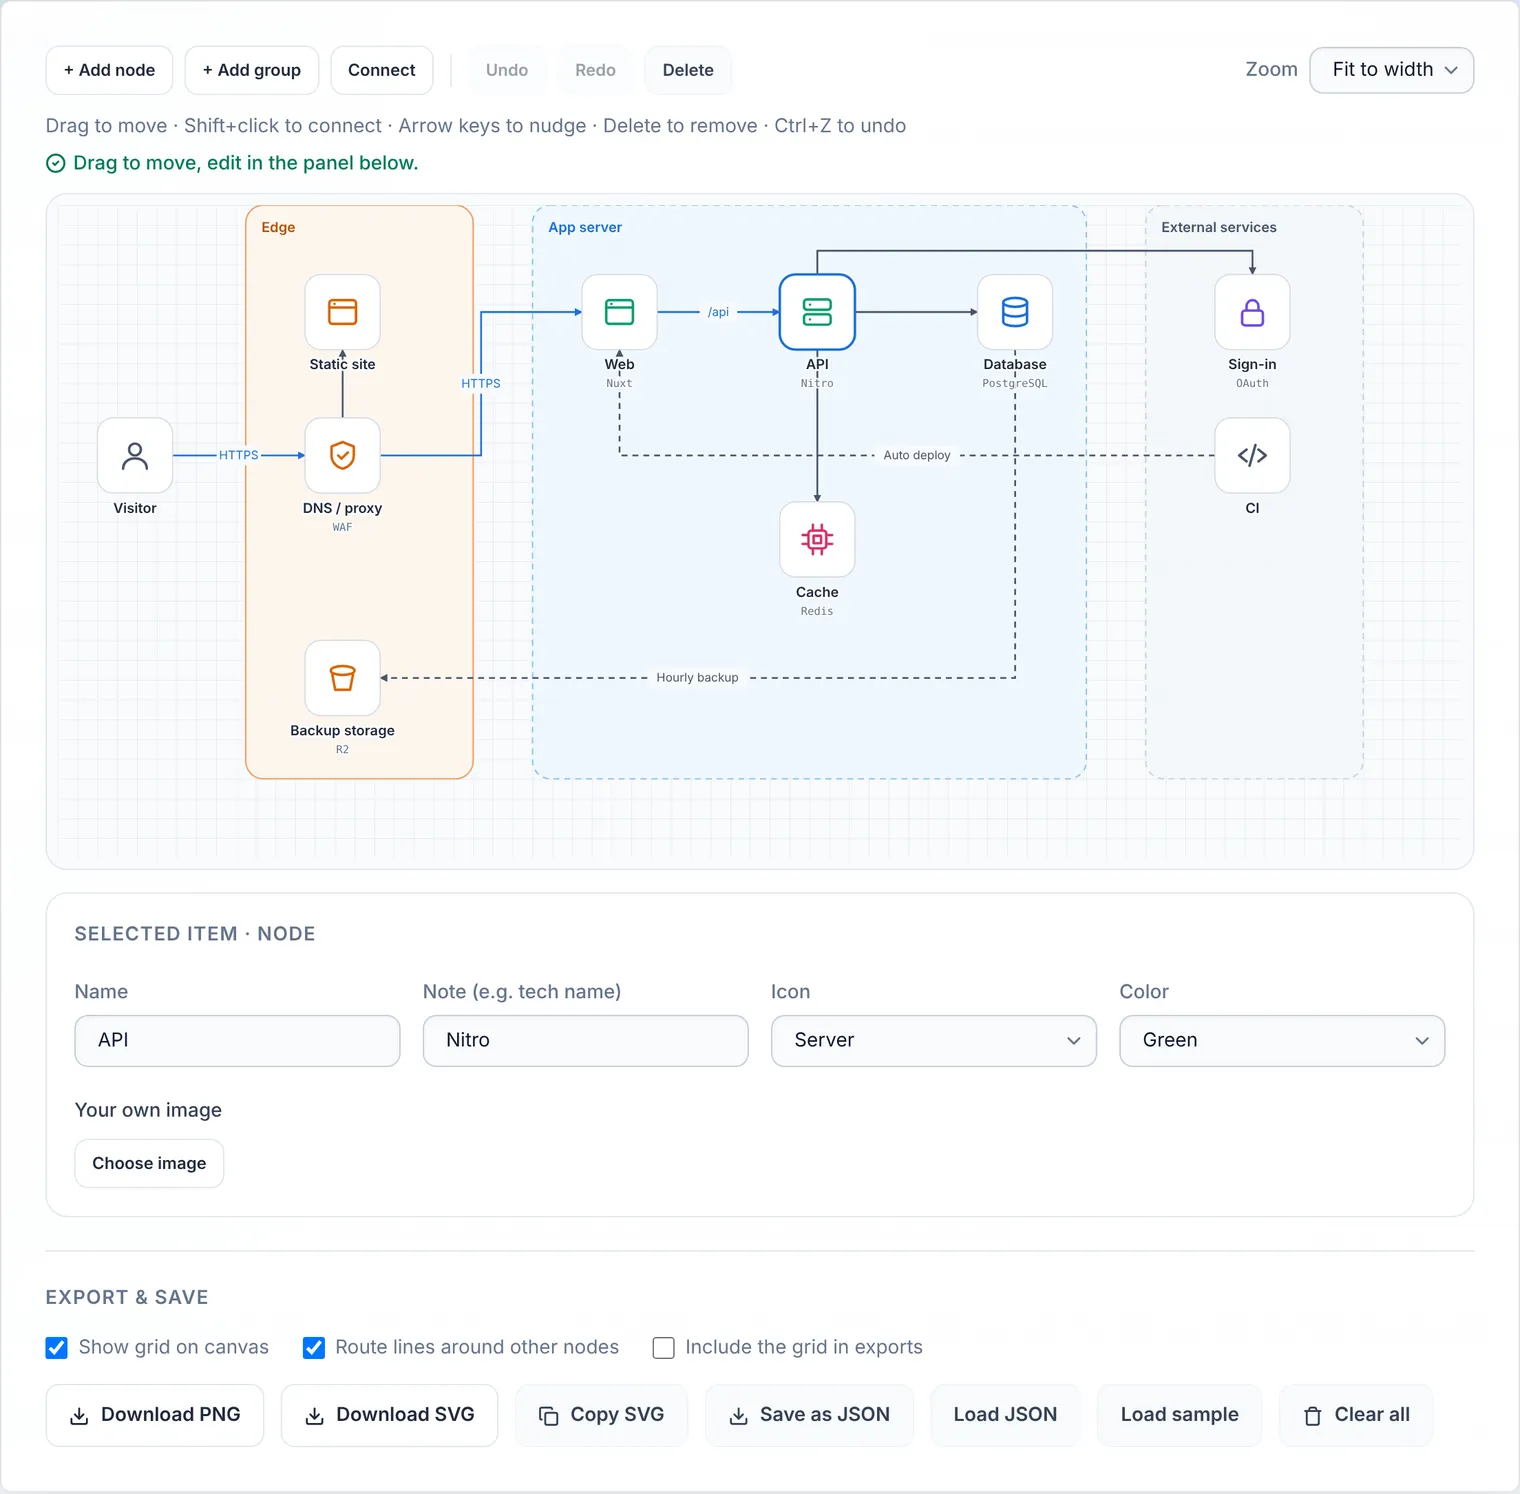
That is why we built the Architecture Diagram Editor. Place icon nodes and group frames freely, and lines connect at right angles automatically, so you get a tidy diagram using nothing but your browser.
What the editor can do
- Group frames: solid or dashed, 7 colors, nestable. Moving a frame moves the nodes inside it
- Icon nodes: 20 generic line icons, plus a note under the name such as
NitroorPostgreSQL - Right-angle lines: labels, dashes, blue color, and a choice of the sides a line leaves and enters
- Your own images: import logos as images (brand logos are not bundled)
- Export: PNG / SVG / JSON, with undo/redo and autosave in your browser
Neither your content nor your images ever leave the browser.
Step by step
Take the classic “users → edge → app server → external services” layout as an example.
- Start with group frames: create three frames, “Edge”, “App server” and “External”, and give them different colors. They become the foundation that shows at a glance where each part runs
- Put nodes inside the frames: with a frame selected, “Add node” places the node inside it. Enter a name and a note (the tech name) and pick an icon
- Draw lines: press “Connect”, then click the start node and the end node. Shift+click on another node while one is selected also works
- Add meaning with labels: use the protocol or path, such as
HTTPSor/api, as the line label - Export: PNG for pasting, SVG for a version that stays crisp when scaled, JSON to keep editing later
Tips for readable diagrams
- Keep the flow left to right (outside to inside): users on the far left, then edge, server and external services, so the traffic reads naturally
- Color only the star lines: making just the main user traffic blue makes the skeleton of the system stand out
- Use dashes for operational flows: backups and deployments are not the main request path, so dash them
- Keep group frames to three or four: too many frames hide the boundaries. Split detail into another diagram
- When a line does not go where you want, set its sides: lines automatically route around other nodes and group names, but you can set the start and end sides (top / bottom / left / right) when you want to decide the route yourself
Manage diagrams like code
Keep the file from “Save as JSON” in your repository: when the setup changes, load it, edit it and review the diff in a PR. If you want text diffs or need Mermaid, the Infrastructure Diagram Builder fits better. Use this editor when layout and icons matter.
FAQ
How is this different from a Mermaid diagram?
Mermaid lays things out automatically, which is convenient, but you cannot fine-tune node positions, icons or nested frames. This editor lets you place things yourself in exchange, so you can produce a polished diagram with boundary frames and icons.
Can I use AWS or Cloudflare icons?
Brand logos are not bundled because they come with usage terms. You can use the generic icons or import your own image (up to 512 KB) per node. Follow each company’s guidelines when using a logo.
Can I share the diagram with others?
Export it as PNG / SVG and paste it, or save it as JSON and pass it along. The recipient can open the same diagram with “Load JSON” and keep editing.
Is my input sent to a server?
No. Everything runs in the browser, and neither the diagram nor imported images leave it. Autosave only uses this browser’s local storage.
Conclusion
If drawing a diagram is a chore, it never gets updated and eventually nobody trusts it. Draw where things run with icons and frames, and let the lines tidy themselves. With that little friction, fixing the diagram when the setup changes stops being a burden. Open the tool and start by editing the sample.